
Think back to the last time a business user said, "This number looks off." The pipeline was green. Row counts matched, the checks passed and the data landed on time. Two days later, someone found that the source team had started marking cancelled orders with status 7 instead of deleting them. Nothing had broken. The numbers were just wrong. I call this semantic drift. The schema is the same, every test passes, and yet the meaning of the data has moved. Usually nobody decided that it should.

In my experience it comes in a handful of forms.
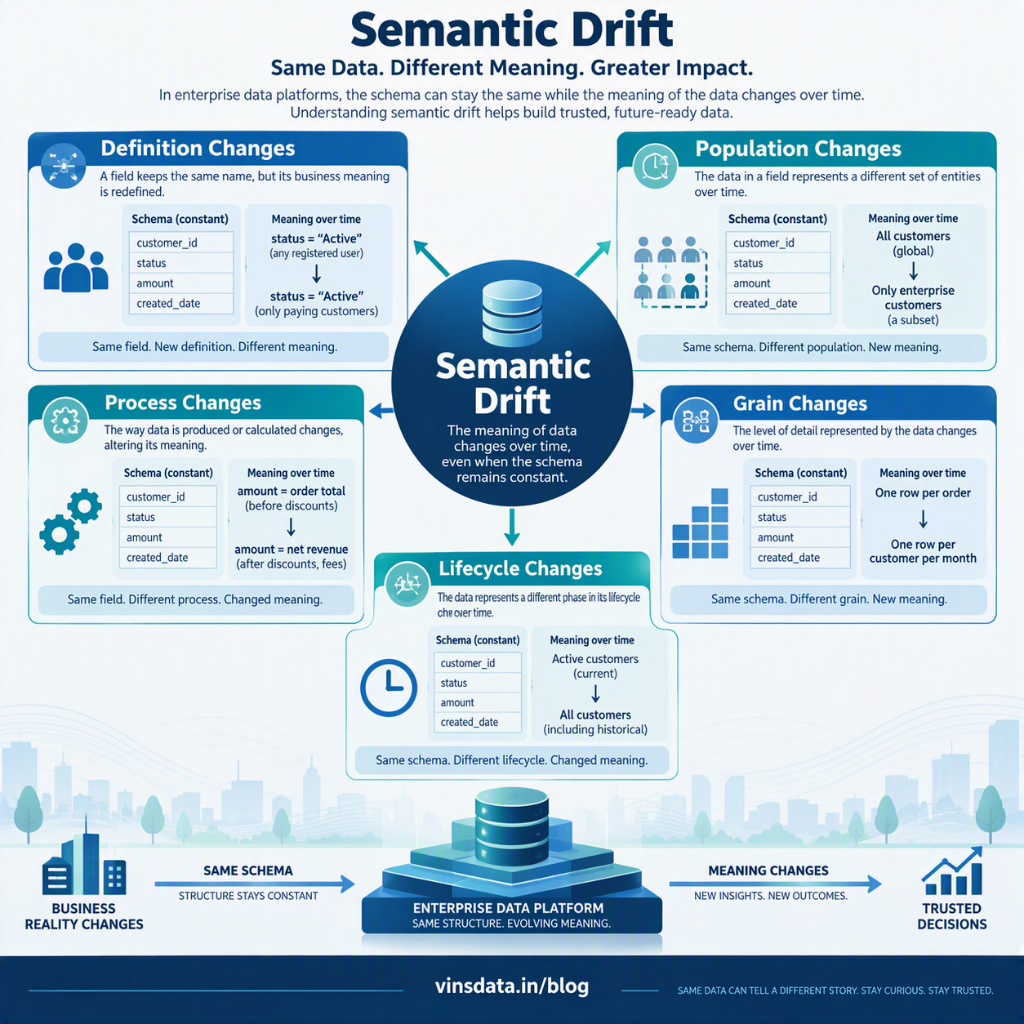
The definition changes. Revenue starts excluding returns, or an active customer goes from 30 days to 90 days. This often follows an acquisition, when a company is moved onto the group's reporting definitions halfway through the year. Both definitions may be perfectly valid, but switching without telling anyone creates a trend break that looks like performance. The population changes. A source adds a region or a sales channel, and the same column now describes a wider group of transactions. A KPI goes up or down, and the cause is simply who is being counted.
The process changes. A free text field becomes a dropdown. A default of zero quietly replaces nulls. An optional step becomes compulsory. Each change looks tidy to the team making it, but downstream it can shift segmentation or a board number.
The grain changes. A table that held one row per order starts holding one row per order line. Joins still work and nothing fails, but the sums are now inflated. Duplicate checks often miss this, because the rows are not duplicates. The meaning of a row has simply changed.
The lifecycle changes. A soft delete rule is revised or an archive job stops running, so records that used to vanish now stay. Active customers, open cases and current subscriptions all shift, though nobody revised the business calculation.
Retention improved noticeably between two reporting periods, and the leadership team was pleased. The engineering team checked the pipelines, the transformations and the reconciliation. All green.
The cause turned out to be a source-system change in how dormant accounts were classified. The source team had made a sensible operational improvement, but it changed which customers counted in the retention figure. The platform had processed the source exactly as it arrived.
The number was still misleading.
The investigation was slow because there was no technical failure to chase. The team spent time in the transformations before anyone asked whether the definition had moved. Now the first question I ask when a KPI moves sharply is whether the meaning has changed or only the mechanics.
Why standard checks miss itSchema tests check shape. Row counts check volume. Freshness checks check timing. Not-null and uniqueness tests check completeness and duplication. Reconciliation checks confirm the arithmetic. All of this is necessary, and none of it asks whether the data still means what its consumers think it means.
A number can pass every technical control and still mislead, so the detection has to look at meaning as well, at least in part.
What has worked for usOne approach I have found useful is to treat each critical column as having a statistical fingerprint, and to watch that fingerprint across loads. I would not monitor everything. I would start small.
Pick the 20 to 50 columns that feed board, investor, finance or regulatory numbers. Finance and operations should help choose them, not just engineering, since they know which fields matter to decisions. Monitoring thousands of minor columns mostly produces alerts that nobody reads.
For each of those columns, capture a profile on every load: null ratio, distinct count, the most frequent values and their share, the range, the mean or median and a few percentiles. For a status code, the mean tells you nothing. New values and their share tell you a lot. Then compare each load with a rolling baseline rather than a fixed threshold. A 4% swing in row count may be ordinary. A status value that did not exist last month and now covers 4% of orders deserves a closer look.
For important categorical fields, keep the list of expected values. A new value need not stop the pipeline, but it should go to an owner for acknowledgement before it reaches executive reporting. Automation can spot the new value. It cannot tell you whether the change is legitimate.
Last, reconcile a critical measure against a number that finance or operations calculates independently. This is the one control I know of that reliably catches definition drift, because two calculations can each be internally consistent and still disagree. When they do, the first question should be whether both teams are measuring the same thing, not which of them is wrong.
On tooling, the products differ but the habit does not. In dbt, accepted values tests are a cheap start. In Microsoft Fabric, a notebook can write profiles to a Lakehouse table after each run. Databricks and Snowflake each have their own monitoring features for this. The hard part is rarely the statistics. It is deciding which movements matter, who reviews them and who can accept a change.
The people sideDrift is seldom malicious. It usually starts with someone making a sensible local change: an analyst tidies a workflow, an application owner adds a status, or a newly acquired business adopts the group's KPI definitions. Each decision makes sense on its own. The trouble is that a data platform links those decisions across systems and reports.
Two habits help. Keep a one-line business definition for each critical metric beside the code, with an owner and an effective date, so that a change becomes a versioned event. And keep a regular line of communication between source owners and the data team, because most of these incidents could have been avoided with a heads-up before go-live.
When a definition really has to change, I prefer to run the old and new versions side by side for an agreed period. That gives stakeholders time to understand the trend break and update targets before the new version becomes official. A trend break is hard to avoid, but it is manageable when announced and painful when someone finds it by accident.
Most of this work is unglamorous. It is profiling, storing history, comparing distributions and asking people before a change lands. It rarely features in a transformation roadmap, but it is often what keeps a business number trustworthy.
A green pipeline tells you the code ran. It does not tell you the data is true. The gap between those two things is where a lot of data trust quietly disappears.Article Topics & Tags