When working with Microsoft Fabric DataWarehouse (DWH), you might notice that the first execution of a query is slower than subsequent runs. This phenomenon known as a cold run, is a normal part of how Fabric optimizes performance and cost. Let’s dig deep why this happens and how to assess query performance accurately.
What Causes a Cold Run in Fabric DW?
A cold run occurs when the system performs initialization or scaling activities before processing your query. These operations ensure optimal performance but introduce a one-time delay. Common causes are…
- Compute Node Initialization
- Fabric DWH automatically pauses compute nodes after inactivity to save costs.
- When you run a query after a period of inactivity, the system has to restart these nodes, adding latency.
- AutoScaling for Increased Workload
- If your query requires more compute power than currently available the Fabric automatically adds new nodes in dynamic fashion.
- The query must wait for these nodes to be ready before starting the execution.
- First-Time Data Loading from OneLake
- When data is accessed for the first time, it must be loaded from OneLake storage into memory.
- Subsequent queries benefit from cached data thereby reducing the latency.
- Automatic Statistics Generation
- Fabric DWH generates query optimization statistics automatically.
- The first execution may be delayed while these statistics are getting collected.
A cold run can be partial: some nodes, data, or statistics might already be available, while others are still initializing.
How to Detect Cold Run Impact ?
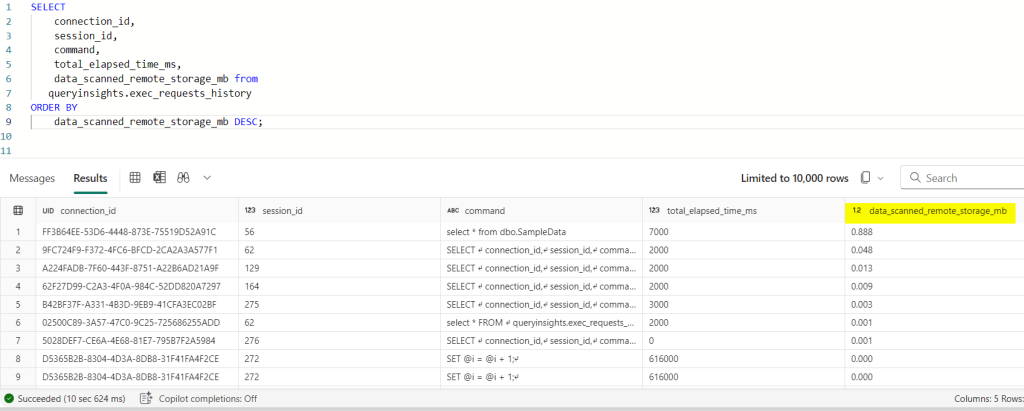
To determine whether a query was affected by a cold start, you can analyze the queryinsights.exec_requests_history view in Fabric DWH.
Check the data_scanned_remote_storage_mb column:
- High values: Data was fetched from OneLake (cold start).
- Zero or low values: Data was already cached (optimal execution).
Example Query:
SELECT
    connection_id,
    session_id,
    command,
    total_elapsed_time_ms,
    data_scanned_remote_storage_mb from
    queryinsights.exec_requests_history
ORDER BY
    data_scanned_remote_storage_mb DESC;
Key Takeaway:
- Because of cold starts, the first execution is often not representative of actual performance. Always:
Run the query multiple times to get a true average duration. - Check data_scanned_remote_storage_mb to confirm if cold start was a factor.
- Remember that subsequent runs will typically be much faster due to caching and node readiness.
By keeping in mind about the cold runs, you can better assess query performance in Fabric DWH and avoid misinterpreting initial delays as inefficiencies.
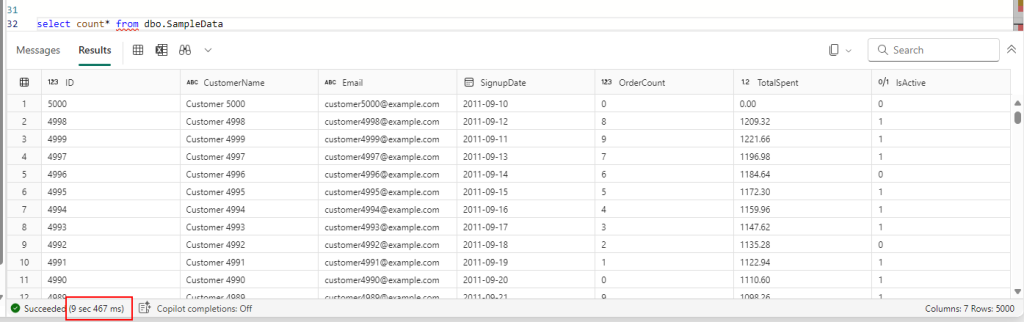
First run took 09.467 seconds to fetch 5k rows
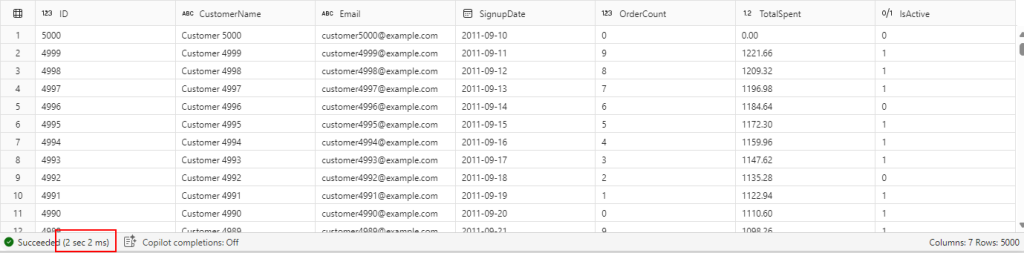
Next run completed in 2 seconds